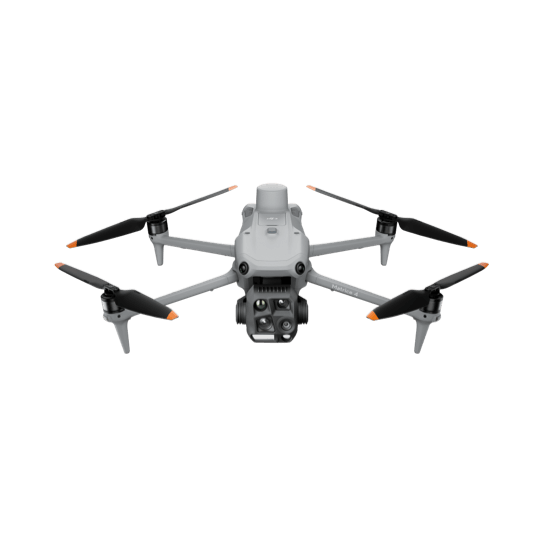
The efficiency comparison between drone capture and manual thermography methods is not a marketing claim - it is a function of physics and geometry. Understanding why the numbers are what they are is more useful than accepting them at face value.
A manual thermography team working a large solar array will typically cover 1-2 MW per day under good conditions. A drone thermal platform operating at appropriate altitude and speed covers 5-10 MW per hour. On a 50 MW farm, the difference is 25-50 days of ground-based work versus a single day of aerial capture.
The coverage rate difference comes from geometry. A ground-based thermographer moves between panel rows, captures individual panels or small groups at a time, and is constrained by access, row spacing, and the physical limits of moving through a large site on foot. A drone flying at 50-80 metres altitude captures an entire swath of the array in a single pass.
Manual thermography of a large array typically samples 10-25% of panels due to time and access constraints. Full manual coverage of every panel in a utility-scale array is rarely operationally feasible. Drone capture covers 100% of panels in a single flight with no sampling methodology required.
Faults are not randomly distributed. They concentrate around specific manufacturing batches, installation patterns, and environmental exposure zones. A sampling approach may miss a developing fault pattern entirely if the sampled panels happen to fall outside the affected area.
Manual thermography of rooftop solar arrays and industrial facilities requires personnel working at height, in constrained spaces, and around energised electrical equipment. Drone capture removes personnel from the asset entirely during the capture phase. Ground access for take-off and landing is all that is required.
Published industry data from Raptor Maps indicates average savings of approximately USD $2,100 per MW captured through drone thermal methods, factoring in reduced labour costs and recovered production losses from earlier fault identification. For a 100 MW farm, that represents a material return on the cost of a monitoring program.
Efficiency and coverage statistics describe what the technology can do under good conditions. They do not account for marginal conditions that require rescheduling, complex site access that adds mobilisation time, or the post-processing and reporting work that turns raw thermal data into an actionable dataset.
Drone capture is significantly faster and more complete than manual alternatives for large assets. The degree to which that advantage translates to your specific site depends on its size, configuration, and access conditions - which is why we do not quote until we understand the site.
Every industry, one standard
Utility-scale solar, a commercial rooftop array, or a single roof - captured to the same standard and read by the same certified thermographer. Tell us what you're working with and we'll come back to you with what the data shows, not a generic quote.
We don't quote until we understand the site. Use the chat in the corner, or see what's included below.
Brisbane, Queensland
South East Queensland & Northern New South Wales
SkySpectra provides aerial thermal and RGB data capture services, including thermographic assessment of thermal imagery by an ITC Level 1 Certified Thermographer. This assessment identifies and classifies thermal anomalies but is not a structural, electrical, or engineering assessment, and does not constitute certification of any asset. Any decision regarding remediation, repair, or compliance must be made by an appropriately qualified professional engaged by the client.