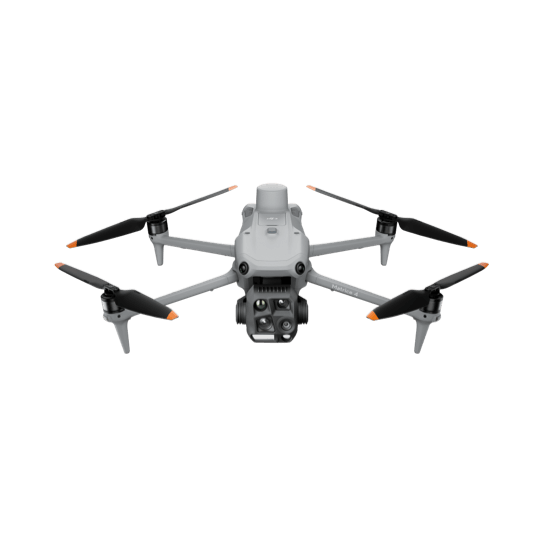
The flight is the visible part of what SkySpectra does. What happens between landing and delivery determines whether the data is actually useful.
The DJI M4T platform captures thermal and RGB data simultaneously across four integrated sensors - thermal, wide-angle, medium telephoto, and long-range telephoto - on a single gimbal. Every image is GPS-tagged at the point of capture via onboard laser rangefinder and RTK positioning.
Thermal and RGB imagery is processed through photogrammetry software to produce georeferenced orthomosaics - accurate, scaled, top-down maps of the full site with every pixel tied to a real-world GPS coordinate. For sites requiring 3D outputs, point clouds and surface models are generated from the RGB dataset.
Thermal orthomosaics are processed to normalise temperature across the dataset - accounting for variation in sensor angle, altitude, and ambient conditions across the flight - producing a consistent temperature map of the full asset.
Anomalies are identified through systematic review of the processed thermal dataset. Each finding is classified by type - hotspot, string deviation, bypass diode pattern, whole-panel anomaly - and assigned GPS coordinates from the georeferenced orthomosaic.
Anomaly identification at SkySpectra is a data capture and documentation function performed under our chief pilot's ITC Level 1 Certified Thermographer credential. We identify what is present in the thermal dataset, classify it, and locate it precisely. We do not diagnose root cause or recommend specific remediation actions.
The standard deliverable is a structured PDF report - covering flight date, conditions, sensor specifications, methodology, and anomaly summary, with GPS coordinates and imagery for each finding. This is what's produced for every visit, whether a one-off capture or part of a Monitoring Program.
Raw and processed files - the georeferenced GeoTIFF and KMZ orthomosaics, and CSV anomaly exports - aren't included by default. They're available on request, for either a one-off capture or a Monitoring Program, where your team needs to work with the data directly in GIS or asset management software.
Delivery timeframe is confirmed at the time of booking - every job is scoped individually. For time-sensitive situations - active warranty claims, regulatory inquiries, or urgent maintenance planning - expedited delivery is available on request.
The PDF report lands with whoever needs a condition record - your O&M team, insurer, or lender. It's built to be handed over directly, with the findings and their locations already in context.
If your team runs its own GIS or asset management platform and wants the underlying GeoTIFF, KMZ, or CSV files to work with directly, let us know and we'll arrange that as part of your booking.
Every industry, one standard
Utility-scale solar, a commercial rooftop array, or a single roof - captured to the same standard and read by the same certified thermographer. Tell us what you're working with and we'll come back to you with what the data shows, not a generic quote.
We don't quote until we understand the site. Use the chat in the corner, or see what's included below.
Brisbane, Queensland
South East Queensland & Northern New South Wales
SkySpectra provides aerial thermal and RGB data capture services, including thermographic assessment of thermal imagery by an ITC Level 1 Certified Thermographer. This assessment identifies and classifies thermal anomalies but is not a structural, electrical, or engineering assessment, and does not constitute certification of any asset. Any decision regarding remediation, repair, or compliance must be made by an appropriately qualified professional engaged by the client.