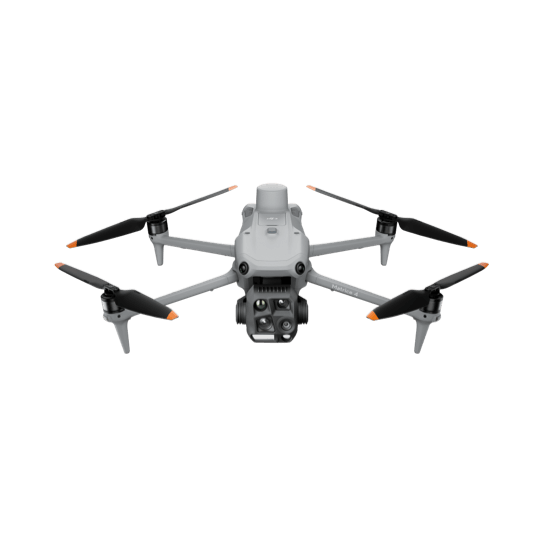
RGB and thermal imaging programs for commercial solar, solar farms, industrial facilities, construction sites, and commercial assets.
Full panel coverage. Single visit.
Most commercial rooftop arrays have not had a thermal capture since commissioning. Panels degrade, connections fail, and hotspots develop - but without panel-level data, the losses are invisible until they show up as reduced output or a rejected warranty claim.
Thermal anomalies identified at individual panel level
GPS coordinates for every finding
Documented evidence for warranty claims and insurance
Available as a single visit - no contract required
When panels underperform, you don't just lose generation — you buy the difference from Origin, AGL, or Ergon at full retail rate. A single faulty string on a large array can be a small share of the total. An older system with no monitoring history at all can be far more. A single thermal capture tells you which one you're dealing with, while it's still under warranty.
Large-scale arrays need more than a walkthrough.
A solar farm with hundreds or thousands of panels cannot be covered by manual methods. String-level monitoring tells you something is wrong but not which panel, where, or why. Warranty windows are closing on farms commissioned in 2019-2021 - faults need to be identified and documented before they expire.
Full array thermal capture - every panel, every visit
Panel-level anomaly identification with GPS coordinates
Warranty-grade documentation before windows close
Structured outputs for comparison across visits
How much of the array is actually affected? A single failed string on a large farm can be a small share of the total. An older farm with no monitoring history at all can be far more. Arrays approaching a warranty review window are worth checking at the higher end - faults accumulate silently, invisible to string-level monitoring and invisible to the eye.
What you can't see from the ground is costing you.
Industrial facilities carry heat-generating assets across rooftops, pipelines, and electrical infrastructure that are impossible to assess safely from ground level. Without aerial thermal data, faults develop undetected until they become failures - and unplanned shutdowns cost more than any monitoring program ever will.
Full facility coverage from the air - no scaffolding, no shutdowns, no HSE exposure
Thermal anomalies on rooftop plant, pipelines, and electrical infrastructure identified at component level
3D model with thermal overlay for complex facilities - maintenance teams navigate directly to a hot pipe joint or failing cabinet in 3D space, not just a flat map coordinate
Documented condition baseline for regulatory evidence, insurance, and asset reporting
Every stage documented. No gaps in the record.
Construction sites change daily and disputes arise from what wasn't captured at the right moment. Progress claims, subcontractor sign-offs, and insurance requirements all depend on having a timestamped visual record that ground-level photography cannot provide.
Timestamped aerial record at every milestone stage - georeferenced orthomosaic and 3D model of the full site
Thermal capture on structures mid-build - identifies heat loss through incomplete insulation before cladding goes on, while there is still time to act
Independent visual evidence for disputes and defect claims - what was built, when, and in what condition
Volume calculations and earthworks progress tracking across visits
Non-invasive aerial monitoring for wildlife and habitat.
Thermal drone capture offers wildlife organisations and conservation groups a non-invasive method for population monitoring, habitat assessment, and rescue operations. Koalas, nocturnal species, and displaced animals that are invisible on the ground show clearly in a thermal dataset captured from the air.
Thermal detection of koalas and nocturnal wildlife in vegetation
GPS-located sightings for rescue and relocation operations
Habitat mapping and vegetation condition assessment
Zero disturbance - all capture conducted from the air
See what your panels are actually doing.
Most homeowners assume a bigger bill just means higher rates or a hot summer - not a failed panel sitting on the roof. Thermal imaging from the air checks every panel in one flight and tells you, the same day, exactly which ones are underperforming and what that's actually costing you.
Every panel checked in one flight - no rooftop access required
Underperforming and failed panels pinpointed at individual panel level
A real number for what it's costing you, worked out from your own system and rates
One visit, one report - no ongoing contract required
A failed panel doesn't show up on your bill as "panel failed" - it shows up as a slightly higher bill, every quarter, indefinitely. Most homeowners never isolate which panel or why. A single thermal capture identifies the exact panel, while it may still be under warranty.
Every industry, one standard
Utility-scale solar, a commercial rooftop array, or a single roof - captured to the same standard and read by the same certified thermographer. Tell us what you're working with and we'll come back to you with what the data shows, not a generic quote.
We don't quote until we understand the site. Use the chat in the corner, or see what's included below.
Brisbane, Queensland
South East Queensland & Northern New South Wales
SkySpectra provides aerial thermal and RGB data capture services, including thermographic assessment of thermal imagery by an ITC Level 1 Certified Thermographer. This assessment identifies and classifies thermal anomalies but is not a structural, electrical, or engineering assessment, and does not constitute certification of any asset. Any decision regarding remediation, repair, or compliance must be made by an appropriately qualified professional engaged by the client.